
The highly questionable 2020 presidential election results
From just about any point of view, the 2020 Presidential Election was bizarre and abnormal -- the high number of votes recorded, increased mail-in/absentee voting, voting rules changed, etc.
To judge voting claims, one needs a standard for comparison. The 2024 presidential vote totals are a public record. Also the 2020 census data, including state (and county) populations, is a public record. Thus the 2020 vote count adjusted relative to 2016 and 2024 vote counts -- two years for standards -- can be examined.
There are 50 states and DC: 51 national voting units. But population sizes differ among states. Wyoming is small and California is large. To account for this, we adjusted votes by state population -- vote count divided by population -- to give the Voter Participation Rate, VPR. Historically, the VPR ranged from 15 to 30 percent for each party, but more recently it has been higher.
VPR allows apples-to-apples comparison of states by their population. The contrast (or jump) in 2020 VPRs versus the average of the years 2016 and 2024 tells us if the 2020 count is normal, or if something smells off. Specifically, we looked at how the jump in VPR differed between Democrats and Republicans for 2020 versus the average for 2016 and 2024.
Looking at the data, we unsurprisingly saw a jump in 2020 -- overall average for 51 voting units of 2.19 percent. The jump was larger for Democrats than for Republicans, average of 3.08 versus 1.29 percent.
The VPRs come in pairs (Democrat, Republican) for each voting unit. The paired differences for the 51 voting units were examined statistically. A difference of 1.80%, favoring Democrats, in 2020 was well beyond chance as an explanation… essentially impossible. The confidence limits of the difference, 1.41−2.18 do not overlap zero, meaning that the difference might be as small as 1.41 or as large as 2.18 percent difference. Something smells off for sure.
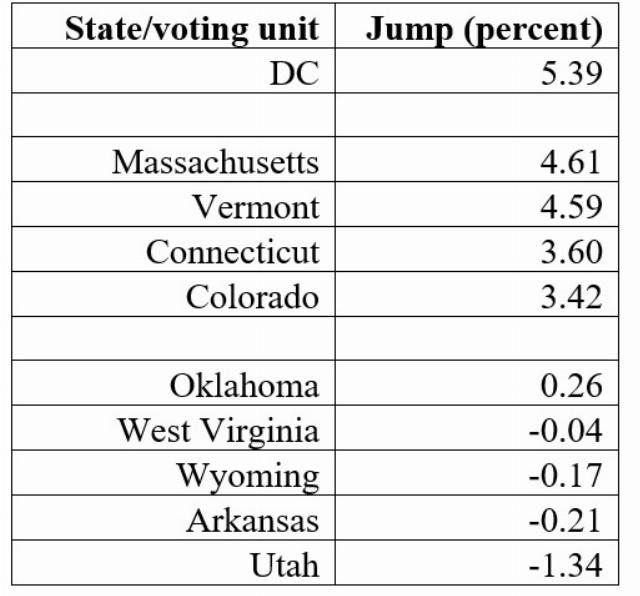
Voting units with the largest positive jumps that favor Democrats in 2020 are given in Table 1, along with the states with the smallest jumps that favor Republicans. The absolute magnitude of the jumps is much larger for Democrats than Republicans, something of a red flag (rotten votes, perhaps).
Table 1. Voting units with the five largest and five smallest voting jump.
There was population growth across the three election cycles -- 2016, 2020, 2024. But overall, it was largely steady growth. Of note, California’s population was essentially constant at 39M, yet there was a dramatic/inexplicable jump of 3.41% in VPR in 2020. Anyone surprised?
To explore other anomalies, we looked at the decline in VPRs for Democrats in 2024 from 2020. The five largest and five smallest Democrat declines are shown in Table 2. There were dramatic declines for Democrat votes in many states.
Table 2. Voting units with the five largest and five smallest Democrat decline in 2024 from 2020.

For comparison, the decline for Republicans in those states was modest. The overall average decline in the Republican VPR was 0.16 and, statistically, did not differ significantly from zero. All odorless with Republication votes.
The stench originates with Democrat votes. The jump in the 2020 Democrat VPR of ~3% was not a chance result. It was larger than the jump for Republicans of ~1.3%, and the difference was not a chance result.
Many were astonished that 2020 Biden votes far surpassed 2008 Obama votes -- 81.3M versus 69.5M. Some wondered whether 2020 votes for Biden were juiced. Our findings agree that smelly circumstances consistent with juicing 2020 votes for Biden occurred.
S. Stanley Young, Ph.D. is the CEO of CGStat in Raleigh, North Carolina and is director of the National Association of Scholars’ Shifting Sands Project. Warren Kindzierski, Ph.D. is a retired college professor (public health) in St Albert, Alberta.
FOLLOW US ON


